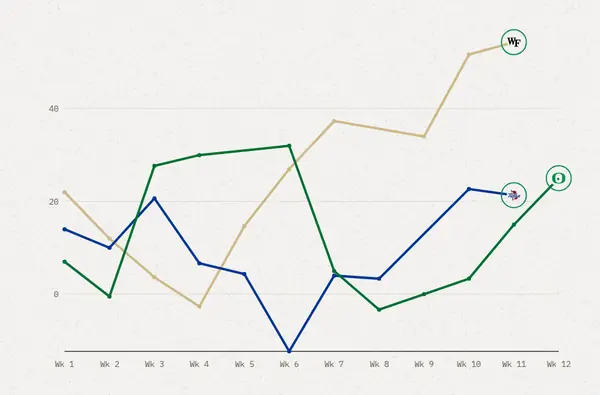
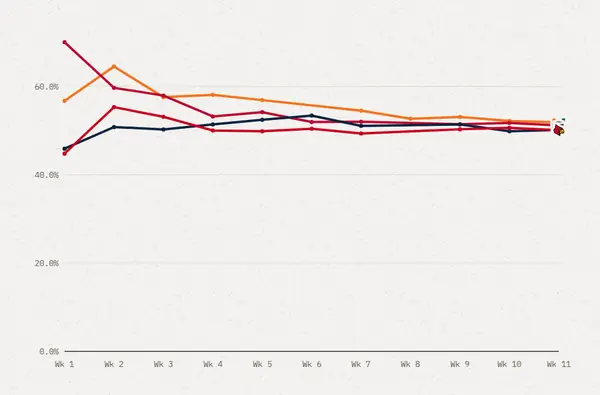
Game of the week: yards per play, last 3 games
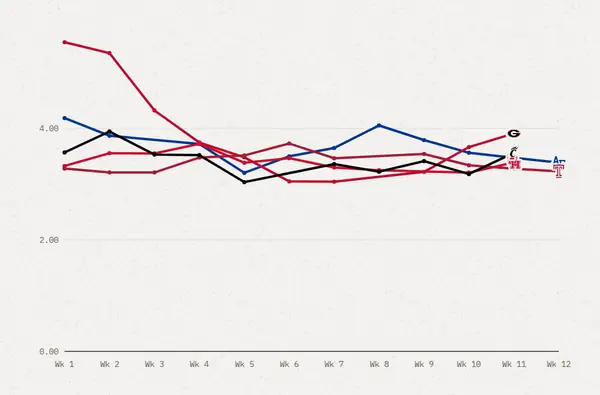
How have the game of the week's teams moved the ball lately?
LSU is on top at 6.23, then Tennessee (5.33). Yards per play tracks scoring better than most box-score stats over a season, so three games show which team is trending up or down.
Game of the week: yards per play, last 3 games
The data behind the chart
Data: 2 teams, yards per play week by week. Sources: Play-by-play from CollegeFootballData.com (the public cfbfastR files), games through Nov 20, 2026.
| Week | LSU | Tennessee |
|---|---|---|
| 1 | 6.78 | 8.90 |
| 2 | 6.54 | 7.90 |
| 3 | 6.10 | 7.53 |
| 4 | 6.28 | 5.77 |
| 5 | 6.69 | 5.38 |
| 6 | 7.01 | 5.29 |
| 7 | 6.48 | 5.62 |
| 8 | 6.30 | 5.28 |
| 10 | 6.26 | 5.48 |
| 11 | 6.23 | 5.33 |
Behind the chart
What the stats mean, what's good, and who just missed.
Each line is one team's yards per play, shown as the average of their last three games. Yards gained per offensive play.
Leader: LSU, 6.23 through Week 11.
Over their last three games, 0 of 2 teams beat their season average and 2 fell short.
Trending up
- No team fits this one yet.
 Tennessee
 LSU
Questions about game of the week: yards per play, last 3 games
What is yards per play?
Yards gained per offensive play.
Why does yards per play matter?
The quickest way to see if an offense actually moves the ball. Over a season, yards per play tracks scoring better than most box-score stats.
Where does the yards per play data come from?
From play-by-play from CollegeFootballData.com (the public cfbfastR files), games through Nov 20, 2026.