Offense vs. defense
Does a team win with offense or defense?
Michigan is 7th in SP+ defense (13.3) and 103rd in SP+ offense (21), the widest gap on the chart. They're built on defense, with a much weaker offense. North Texas is the reverse, 17th in SP+ offense (36.1) and 118th in SP+ defense (33.4). They're built on offense, with a defense that gives up a lot.
Offense vs. defense
The data behind the chart
Data: 138 teams: all of FBS. X-axis: SP+ offense: points the offense would score against an average defense. Better is to the right. Y-axis: SP+ defense: points the defense would allow to an average offense. Better is higher. Sources: SP+ by Bill Connelly (CFB Update). Data through Nov 20, 2026.
| Team | SP+ offense | SP+ defense |
|---|---|---|
| Air Force | 27.90 | 25.30 |
| Akron | 13.50 | 39.00 |
| Alabama | 36.40 | 14.00 |
| App State | 23.00 | 27.60 |
| Arizona | 37.10 | 22.10 |
| Arizona State | 26.10 | 23.00 |
| Arkansas | 25.10 | 26.20 |
| Arkansas State | 24.40 | 31.40 |
| Army | 29.50 | 31.70 |
| Auburn | 26.40 | 20.90 |
| Ball State | 17.20 | 37.40 |
| Baylor | 29.30 | 18.70 |
| Boise State | 39.70 | 26.70 |
| Boston College | 20.70 | 28.40 |
| Bowling Green | 15.70 | 32.70 |
| Buffalo | 18.50 | 27.30 |
| BYU | 33.60 | 16.20 |
| California | 19.20 | 31.50 |
| Central Michigan | 17.40 | 27.80 |
| Charlotte | 14.60 | 39.40 |
| Cincinnati | 32.30 | 31.90 |
| Clemson | 20.30 | 19.50 |
| Coastal Carolina | 22.90 | 30.50 |
| Colorado | 23.90 | 27.20 |
| Colorado State | 28.50 | 41.30 |
| Delaware | 26.80 | 33.60 |
| Duke | 32.10 | 20.50 |
| East Carolina | 20.10 | 23.50 |
| Eastern Michigan | 14.70 | 32.20 |
| Florida | 29.50 | 23.50 |
| Florida Atlantic | 31.90 | 35.20 |
| Florida International | 16.90 | 26.10 |
| Florida State | 31.50 | 25.60 |
| Fresno State | 28.10 | 24.30 |
| Georgia | 40.50 | 9.40 |
| Georgia Southern | 27.50 | 23.90 |
| Georgia State | 25.90 | 33.90 |
| Georgia Tech | 24.40 | 29.80 |
| Hawai'i | 16.50 | 26.50 |
| Houston | 37.00 | 24.70 |
| Illinois | 29.10 | 22.70 |
| Indiana | 33.20 | 9.90 |
| Iowa | 29.10 | 12.00 |
| Iowa State | 28.10 | 28.20 |
| Jacksonville State | 27.60 | 25.10 |
| James Madison | 32.60 | 22.30 |
| Kansas | 28.40 | 23.70 |
| Kansas State | 29.40 | 25.30 |
| Kennesaw State | 21.70 | 29.20 |
| Kent State | 12.40 | 33.70 |
| Kentucky | 30.70 | 22.80 |
| Liberty | 32.60 | 17.50 |
| Louisiana | 30.20 | 25.70 |
| Louisiana Tech | 29.40 | 24.50 |
| Louisville | 39.80 | 22.40 |
| LSU | 36.50 | 13.90 |
| Marshall | 21.80 | 33.60 |
| Maryland | 26.60 | 27.20 |
| Massachusetts | 18.50 | 28.50 |
| Memphis | 36.90 | 26.90 |
| Miami | 42.90 | 18.90 |
| Miami (OH) | 24.00 | 26.70 |
| Michigan | 21.00 | 13.30 |
| Michigan State | 20.60 | 24.00 |
| Middle Tennessee | 21.80 | 36.10 |
| Minnesota | 20.40 | 22.40 |
| Mississippi State | 27.00 | 26.30 |
| Missouri | 29.40 | 18.40 |
| Missouri State | 19.50 | 32.00 |
| Navy | 30.10 | 32.60 |
| NC State | 28.90 | 30.90 |
| Nebraska | 30.50 | 13.50 |
| Nevada | 19.70 | 24.00 |
| New Mexico | 27.30 | 14.00 |
| New Mexico State | 15.90 | 30.70 |
| North Carolina | 28.30 | 23.00 |
| North Dakota State | 25.10 | 14.50 |
| North Texas | 36.10 | 33.40 |
| Northern Illinois | 12.80 | 40.40 |
| Northwestern | 31.50 | 20.70 |
| Notre Dame | 40.10 | 15.00 |
| Ohio | 23.60 | 26.00 |
| Ohio State | 37.40 | 13.40 |
| Oklahoma | 22.20 | 15.10 |
| Oklahoma State | 39.60 | 27.20 |
| Old Dominion | 13.20 | 27.20 |
| Ole Miss | 35.30 | 23.10 |
| Oregon | 34.40 | 16.40 |
| Oregon State | 33.10 | 28.70 |
| Penn State | 30.30 | 17.90 |
| Pittsburgh | 28.00 | 19.60 |
| Purdue | 27.50 | 31.70 |
| Rice | 18.90 | 34.30 |
| Rutgers | 23.40 | 35.00 |
| Sacramento State | 9.40 | 35.40 |
| Sam Houston | 11.10 | 32.30 |
| San Diego State | 23.90 | 29.60 |
| San José State | 13.80 | 25.70 |
| SMU | 34.40 | 22.70 |
| South Alabama | 26.60 | 36.10 |
| South Carolina | 32.10 | 21.30 |
| South Florida | 26.90 | 23.90 |
| Southern Miss | 20.70 | 37.40 |
| Stanford | 23.10 | 32.10 |
| Syracuse | 26.10 | 28.30 |
| TCU | 23.90 | 15.70 |
| Temple | 22.50 | 34.50 |
| Tennessee | 33.80 | 12.90 |
| Texas | 34.10 | 12.20 |
| Texas A&M | 26.00 | 19.60 |
| Texas State | 37.20 | 29.90 |
| Texas Tech | 39.70 | 20.90 |
| Toledo | 27.00 | 22.60 |
| Troy | 16.30 | 29.60 |
| Tulane | 18.80 | 29.90 |
| Tulsa | 29.80 | 26.40 |
| UAB | 20.70 | 25.50 |
| UCF | 26.20 | 25.90 |
| UCLA | 33.00 | 11.90 |
| UConn | 31.30 | 29.80 |
| UL Monroe | 15.10 | 38.60 |
| UNLV | 25.20 | 28.10 |
| USC | 35.30 | 21.20 |
| Utah | 39.80 | 18.10 |
| Utah State | 17.20 | 23.40 |
| UTEP | 10.90 | 36.50 |
| UTSA | 32.20 | 29.00 |
| Vanderbilt | 24.00 | 26.80 |
| Virginia | 25.50 | 21.60 |
| Virginia Tech | 29.90 | 25.90 |
| Wake Forest | 38.20 | 16.20 |
| Washington | 28.30 | 18.90 |
| Washington State | 18.70 | 28.40 |
| West Virginia | 32.60 | 35.40 |
| Western Kentucky | 21.30 | 33.30 |
| Western Michigan | 24.40 | 23.40 |
| Wisconsin | 23.60 | 15.70 |
| Wyoming | 21.00 | 24.50 |
Behind the chart
What the stats mean, what's good, and who just missed.
Where does a team's strength come from? Further right is a better offense and higher is a better defense, both by SP+.
There is a moderate relationship here (r = +0.51; r runs from −1 to +1, and positive means the two go together): teams better on SP+ offense tend to be better on SP+ defense. SP+ offense accounts for about 26% of the differences in SP+ defense across the 138 teams shown.
Split by the averages: 47 teams land in Complete teams, 18 in Defense first, 25 in Offense first and 48 in Struggling.
Pac-12: 1 of its 8 teams land in Complete teams and 2 in Struggling. The best of them is Boise State (6th and 77th of 138).
Mountain West: 2 of its 10 teams land in Complete teams and 5 in Struggling. The best of them is New Mexico (66th and 11th of 138).
Best on both sides of the ball
 Georgia
 Notre Dame
 Ohio State
 Miami
 Indiana
 LSU
Worst on both sides of the ball
 Northern Illinois134th in SP+ offense, 137th in SP+ defense
 Sacramento State138th in SP+ offense, 127th in SP+ defense
 Akron132nd in SP+ offense, 135th in SP+ defense
 UTEP137th in SP+ offense, 131st in SP+ defense
 Charlotte130th in SP+ offense, 136th in SP+ defense
 UL Monroe128th in SP+ offense, 134th in SP+ defense
Questions about offense vs. defense
What is SP+ offense?
SP+ offense: points the offense would score against an average defense. Higher is better.
Why does SP+ offense matter?
How many points an offense is worth against an average defense. That beats raw points per game when half the schedule is cupcakes.
Where does the SP+ offense data come from?
From Where the data comes from. SP+ by Bill Connelly (CFB Update).
What is SP+ defense?
SP+ defense: points the defense would allow to an average offense. Lower is better.
Why does SP+ defense matter?
Same idea for the defense: what it would give up to an average offense. It doesn't get fooled by a soft schedule.
Where does the SP+ defense data come from?
From Where the data comes from. SP+ by Bill Connelly (CFB Update).
More team charts
Two stats, every FBS team: who sits where and what it means. Fast starters vs. closersWho wins the first half and who wins the second?
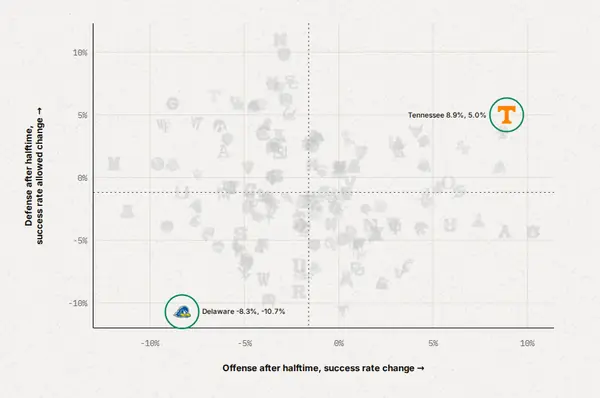 Halftime adjustmentsWho gets better after the break? Across is how much an offense's success rate changes from the first half to the second.
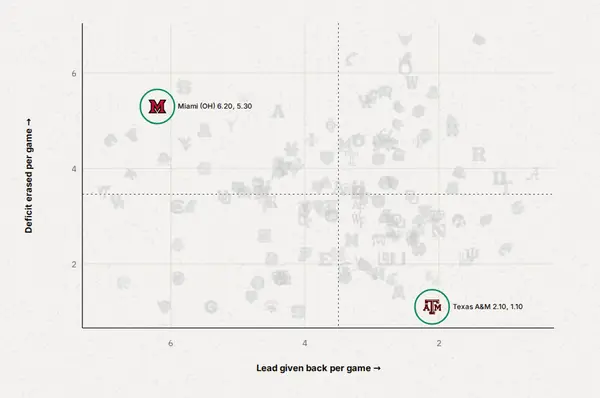 Comebacks vs. collapsesWho closes and who collapses? Up is how many points of deficit a team erases in an average game: down 14 and losing by 3 is 11 erased.
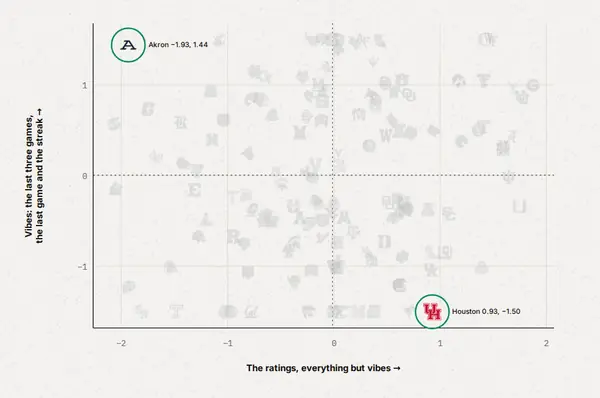 Vibes vs. the ratingsWho's playing better or worse than their ratings right now?
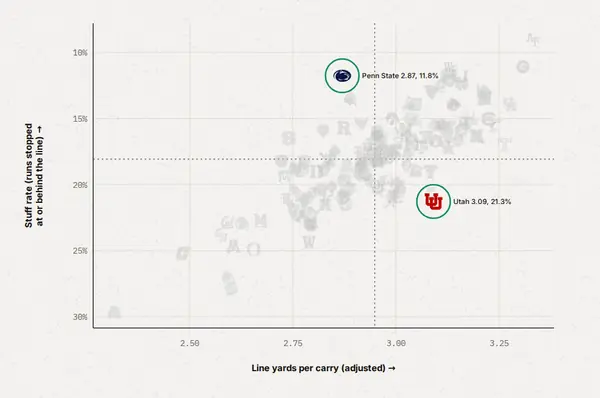 Big Uglies: who wins up front?Which offensive lines win up front? Further right, the line earns more yards per carry on its own.
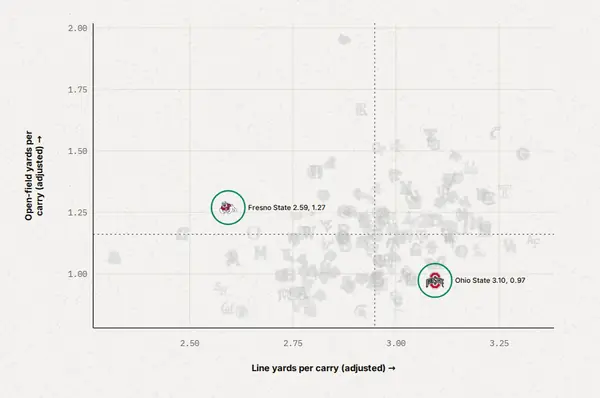 Is it the line or the back?Is it the line or the back? Line yards are the first few yards of each run, the part the offensive line earns.