Best offenses: success rate
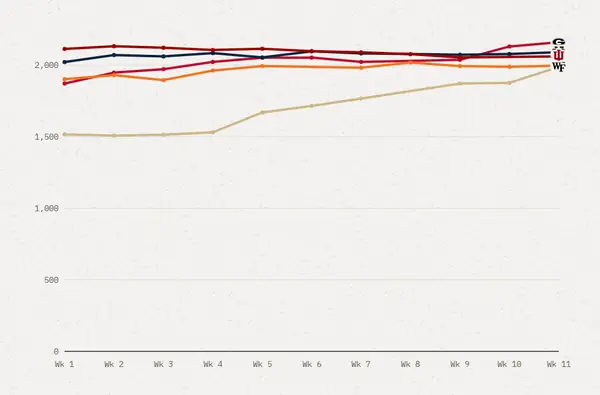
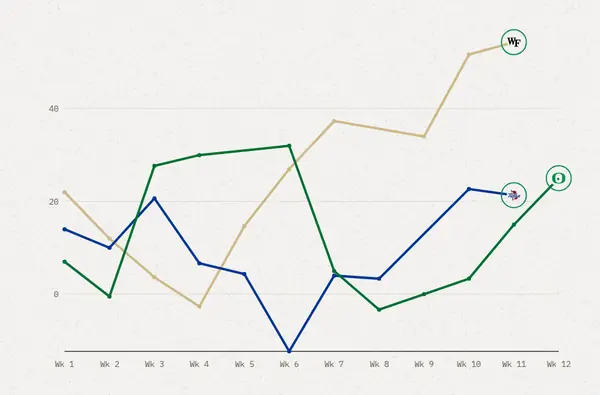
How consistently do the best offenses stay on schedule?
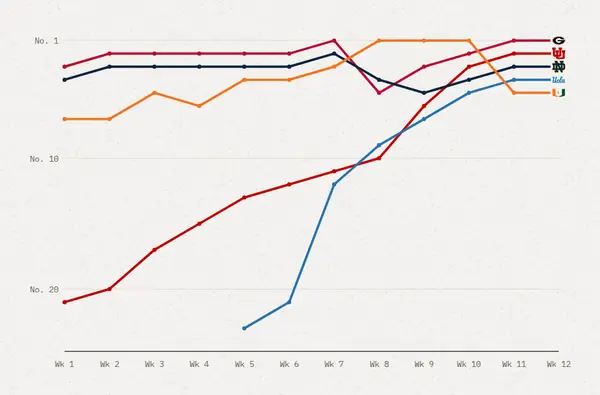
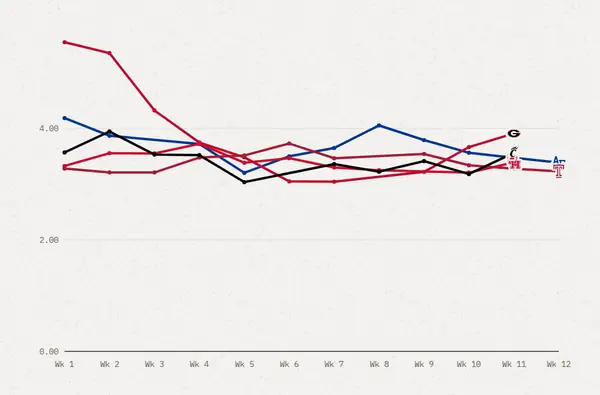
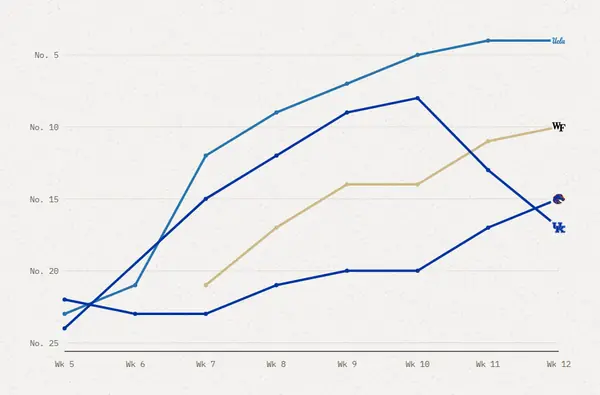
Miami is on top at 51.9%, then Georgia (51.1%). Steady lines are offenses you can trust, and spiky ones depend on who they play.
Best offenses: success rate
The data behind the chart
Data: 4 teams, success rate week by week. Sources: Play-by-play from CollegeFootballData.com (the public cfbfastR files), games through Nov 20, 2026.
| Week | Miami | Georgia | Notre Dame | Louisville |
|---|---|---|---|---|
| 1 | 56.7% | 70.0% | 45.9% | 44.8% |
| 2 | 64.5% | 59.7% | 50.8% | 55.3% |
| 3 | 57.6% | 57.9% | 50.3% | 53.1% |
| 4 | 58.1% | 53.2% | 51.4% | 50.0% |
| 5 | 56.9% | 54.2% | 52.5% | 49.8% |
| 6 | — | 51.9% | 53.4% | 50.4% |
| 7 | 54.5% | 52.0% | 51.0% | 49.3% |
| 8 | 52.7% | — | — | — |
| 9 | 53.1% | 51.4% | 51.4% | 50.3% |
| 10 | 52.2% | 51.7% | 49.8% | 50.6% |
| 11 | 51.9% | 51.1% | 50.1% | 50.1% |
Behind the chart
What the stats mean, what's good, and who just missed.
Each line is one team's success rate, shown as the season so far, all games added up. The share of offensive plays that are successful. A successful play gains 50% of the yards needed on 1st down, 70% on 2nd, and all of it on 3rd and 4th.
Leader: Miami, 51.9% through Week 11.
Over their last three games, 1 of 4 teams beat their season average and 3 fell short.
 Louisville
 Notre Dame
 Georgia
 Miami
Questions about best offenses: success rate
What is success rate?
The share of offensive plays that are successful. A successful play gains 50% of the yards needed on 1st down, 70% on 2nd, and all of it on 3rd and 4th.
Why does success rate matter?
Success rate tells you if an offense stays on schedule. Teams that live in 2nd-and-5 win a lot more than teams that live in 2nd-and-10.
Where does the success rate data come from?
From play-by-play from CollegeFootballData.com (the public cfbfastR files), games through Nov 20, 2026.